 4 Comments
In mansion and Benzes?
The preliminary results from the University Senate’s much-touted Quality of Life survey were released this weekend. Bwog looked at numbers so you don’t have to, and here’s what we found interesting:
Note: all results are based on the pool of people who responded, so data is not representative of entire student body but rather the 17.29% of students from the entire university who actually took the time to fill in answers.
- The highest overall satisfaction across the university is with basic facilities and infrastructure: Safety, Transportation, Library, Academics, and Technology.
- Overall, Funding, Career Prep, and Health are the most important factors with the least satisfaction.
- Undergraduate students are negatively satisfied with the Administration–the only facet for which we have negative satisfaction (although Availability of Space comes close with a solid 0 satisfaction. We see you, performing groups.)
- Undergraduates are much less satisfied with mental health than the rest of the university. On a scale of -.5 to 2, the average across schools is .64. For undergrads, it’s half that at .35.
- Of the undergraduate schools, Barnard is the least likely to donate to the school, by a decent margin. On a scale of -3 to 3, they’re at .2, while SEAS is right above them at .34. Yikes? In likelihood to donate, it ranks GS, CC, SEAS, and BC.
- Still, overall, undergraduates are more likely to donate than grad students–with the exception of the B-School. Prob cuz, you know, they make money.
- We’re alright with Housing, but the Quality of Spaces is not as great.
- Across the schools, there’s a huge dissatisfaction with funding, but most of that negativity comes from grad and PhD students.
- Overall undergrads are typically more satisfied with things than PhD/grad, with the exception of Physical and Mental Health and Administration. Social (lol) and Availability of Space are slightly less satisfactory for undergrads, but doesn’t seem to be statistically significant.
And what about the identities of the people who filled this out?
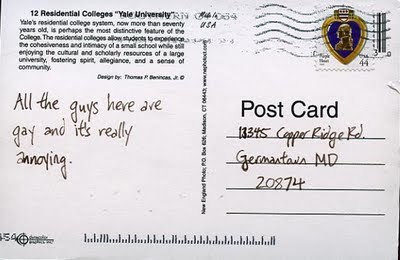
- Straight girls should stop using the excuse that they don’t have a boyfriend because everyone here is gay: only 10% identified as LGBTQ.
- Instead, straight girls should use the gender divide as their excuse: 60% of respondents identified female.
- Nearly 25% of respondents are ESL students, and 20% are international students.
- 60% are white. The second highest represented ethnicity was Asian-Pacific, with ~20&.
Bwog’s home via Shutterstock
4 Comments
@Anon A lot of the results being reported here mean nothing without the actual survey ratings. Maybe that should have been the focus of this post instead of trite commentaries on a serious step in the direction of student wellness.
@I can only speak for myself but my quality of life here is absolute utter booshit thanks to administration
@CC '16 Can we even call this life?
@Administrator This survey is clearly flawed. People like us- it’s a fact.