0 Comments
Bwog’s sidebar just got a bit snazzier. And more informative.
We’ve updated our website to feature a graph of campus COVID-19 test positivity rates:
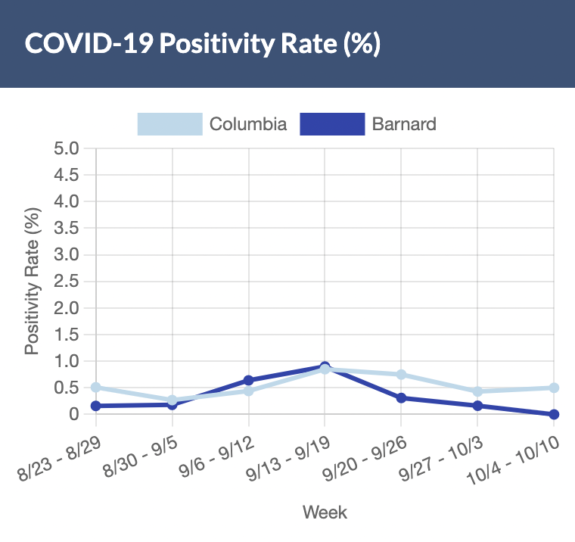
You can find the interactive version of the graph on the sidebar of our homepage. For the methodology behind the graph, check out our COVID @ Columbia posts where we include a bigger version of the graph with more details. Email braner@bwog.com or board@bwog.com with any questions, and stay safe out there.
Image via Bwog Tech/Bwog homepage